Euro, GFS and both Google medians are close at the same forecast time.
STORM BRIEFING SEPTEMBER 25–27, 2026
A slow turn toward the coast.
The models converge on a northward track, a westward turn toward New Jersey, and weakening Sunday. The stronger scenarios are still worth watching.
September 25 morning forecast snapshotAnalysis through approximately 11 am EDT · Not live
Locally 60 mph in the morning forecast, especially Friday night–Saturday morning.
One WN3 member at 2 am Saturday. An outlier, not the expected outcome.
MODEL COMPARISON
Track, pressure & wind
Google + GFS: September 25, 06 UTC. Euro: September 25, 00 UTC. NOAA: 10:30 UTC bulletin. All forecast times below are EDT.
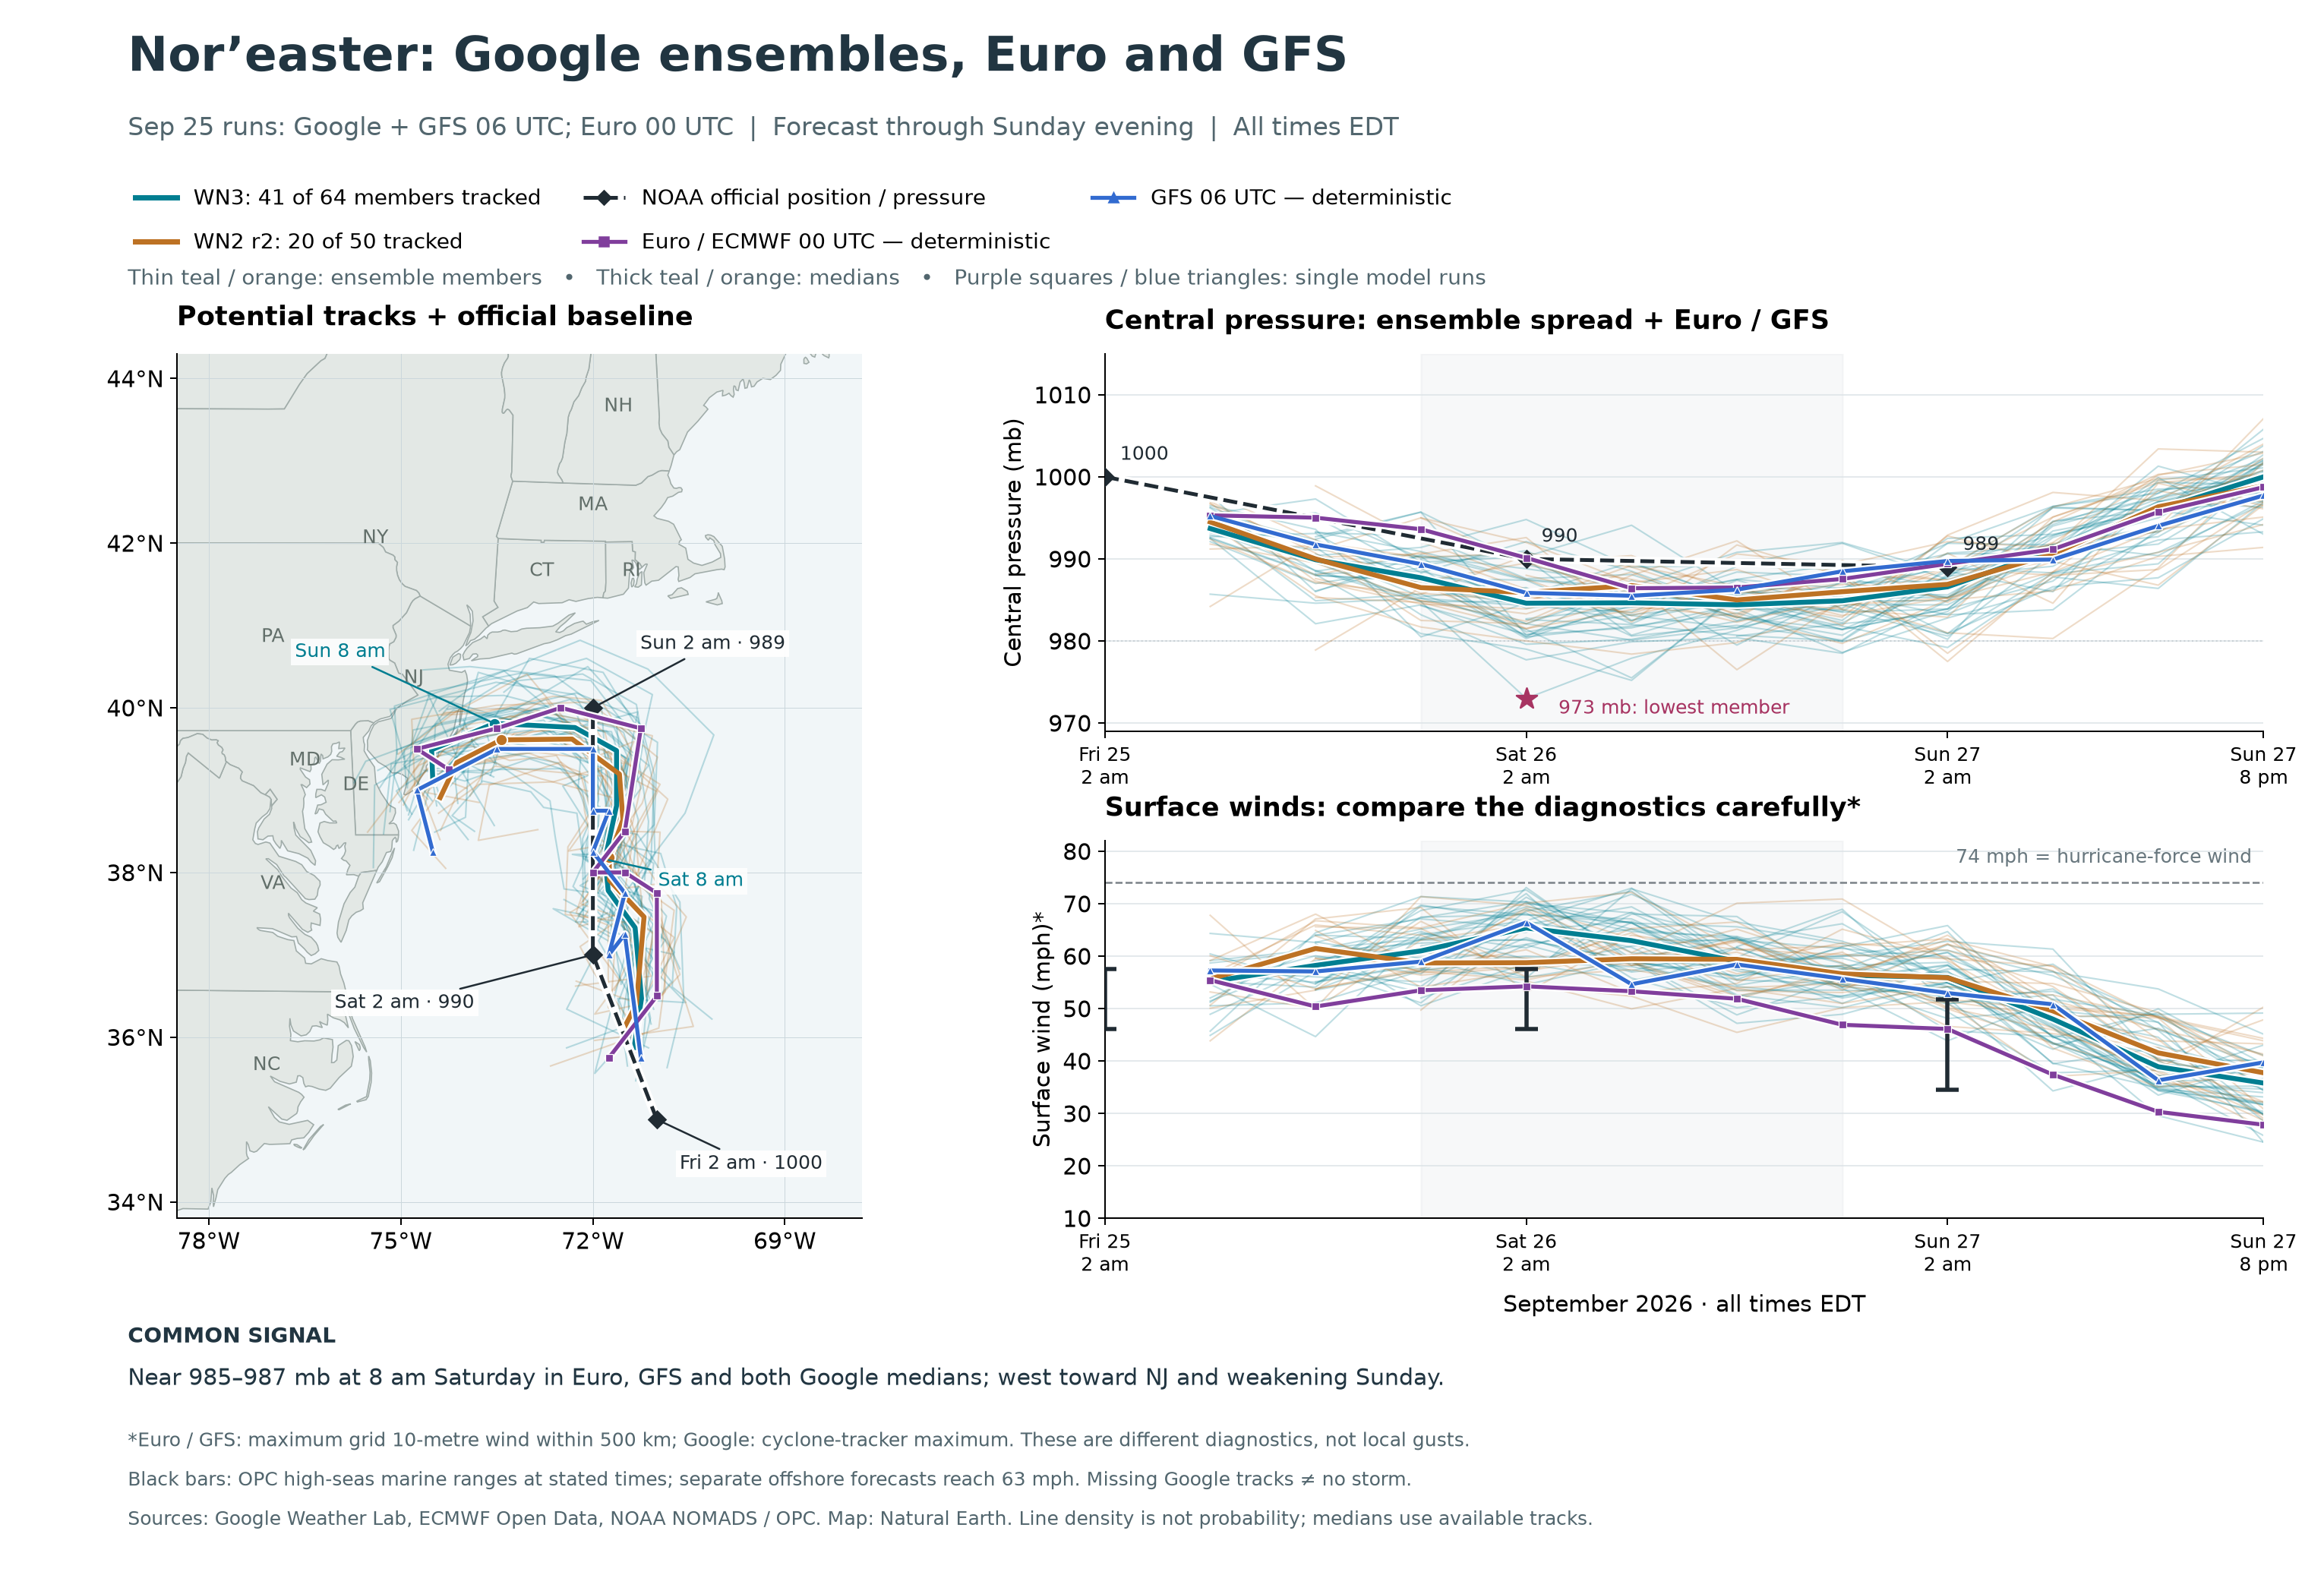
Read the winds carefully. Euro/GFS lines show maximum resolved 10-metre winds within 500 km of the low; Google uses a cyclone-tracker maximum. Black bars are NOAA marine-area ranges. These are different measures, and none is a local land-gust forecast. Separate NOAA offshore forecasts reach 55 knots (63 mph).
THE SHARED TRACK
North, then west.
- Friday into Saturday
Strengthening offshore. By Saturday morning, Euro and GFS put the center near 38°N, 72°W.
- Sunday morning
Both shift west to 73.5°W, south of Long Island, closely matching the Google tracks.
- Sunday afternoon and beyond
The low approaches the New Jersey coast and weakens. A slow loop keeps unsettled weather around into early next week.
INTENSITY AT A GLANCE
Similar track. Different extremes.
| Guidance | Lowest pressure | Peak wind* |
|---|---|---|
| Euro | 986.4 mb | 55 mph |
| GFS | 985.5 mb | 66 mph |
| WN3 | 980.8 mb† | 68 mph† |
| WN2 r2 | 982.6 mb† | 65 mph† |
*Surface-wind diagnostics differ; see the note above. †Google values are medians of individual members’ minima and peaks, which occur at different times. At 8 am Saturday, the four forecasts are much closer: 984.6–986.8 mb.
The previous 970.2 mb Google solution is absent from these runs. The lowest new members reach 973.0 mb in WN3 and 976.5 mb in WN2.
WHAT THIS DOES — AND DOESN’T — TELL US
A nor’easter remains the baseline.
A deep low or warm seclusion alone does not make a tropical cyclone. These exported tracks lack the temperature profiles and frontal diagnostics needed to estimate a warm-core transition probability.
Only 41 of 64 WN3 members and 20 of 50 WN2 members have a selected exported track for this low. Missing tracks do not mean “no storm,” and line density is not a calibrated probability. Euro and GFS are single deterministic runs; their ensembles are not drawn here.
Sources & downloads
Plotted data CSV ↓This page preserves the morning analysis. Forecasts and warnings at the source links may have changed since this snapshot.
- Google Weather Lab · WeatherNext 3 and WeatherNext 2 r2 cyclone exports, September 25 at 06 UTC.
- ECMWF Open Data · Euro 00 UTC, 0.25° output.
- NOAA NOMADS · GFS 06 UTC, 0.25° output. Extracted data with exact source URLs.
- NOAA Ocean Prediction Center · High-seas positions/pressure and offshore wind forecasts.
- NWS Boston/Norton · Cape and Islands gust forecast; September 25, 2:59 am EDT discussion.
How the plots were made
Google tracks were selected if they entered 30–46°N, 79–60°W between September 25 00 UTC and September 28 04 UTC. One qualifying track per selected member was verified. Medians use available tracks at each valid time. The plotted window ends Sunday at 8 pm EDT.
Euro/GFS centers are regional sea-level pressure minima within 32–44°N, 79–67°W. Wind maxima use the resolved 10-metre vector wind within 500 km of the center in the downloaded region. Forecasts are sampled every six hours; grids and sampling can miss small or brief extremes. Pressure in hPa equals mb.
The combined download contains 616 Google points, 22 Euro/GFS points and three official positions. Map boundaries: Natural Earth. Model data attribution: Google DeepMind, ECMWF and NOAA.